Parallel Lines
Under the umbrella of Parallel Lines, the Grid is the first product for options trader to explore trading strategies and risk.
The Grid
The Grid
-
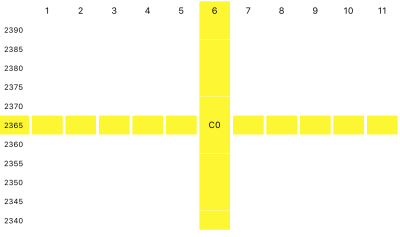 The Strategy PaneThe Grid is intuitive and easy to use, where the top pane serves as a strategy planning board and the bottom pane shows the corresponding PnL/Greeks. The rows correspond to a series of strike prices, with the ATM strike at the center. The columns represent the series of expiration dates. A strategy is considered as a single long or short option, or a combination of a number of long or short positions. Tap on a grid cell to select it, swipe up or down to select the call ("C") or put ("P") option type. Swiping to the left to decrease the number of contract (short position with a negative quantity), and to the right to increase the number (long position with a positive quantity).
 -
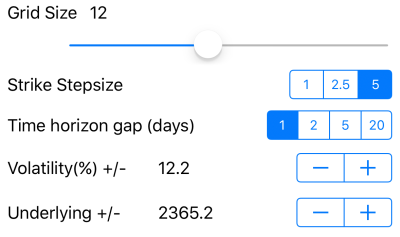 SettingsA trader can change the underlying security level and volatility to test on a hypothetical market. The VIX is used as a default proxy volatility for the underlying. User needs to adjust the volatility level properly to commensurate the underlying security. The grid size, strike levels and expiry date gap can be adjusted in the setting page.
 -
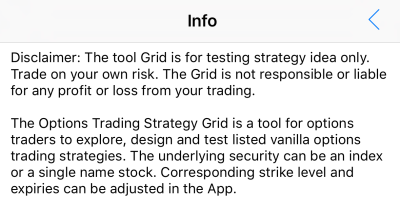 InfoThe info page has full details about the Grid and how to use the App.
 -
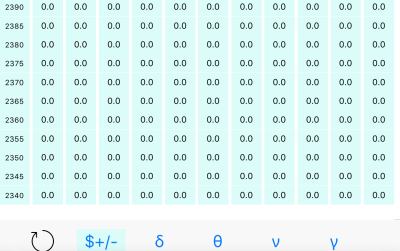 PnL/GreeksAfter a strategy is changed in the strategy pane, the PnL/Greeks view is refreshed with new strategy entry price is refreshed and PnL/Greeks. The PnL based on the entry price is calculated as the change to the strategy value assuming the market moves to the corresponding price level at the corresponding time horizon. The Delta and Gamma are adjusted as the change to the strategy value and Delta per a change of the underlying price at the strike step size. The Vega is the value change per 1% of volatility change. The Theta is the value change every business day. A gradual transitional color scheme represents profit or loss, where the golden corresponds to more profit and blue to more loss.
 -
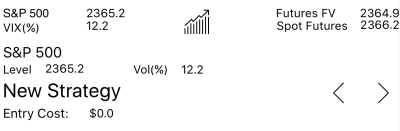 Market and Preset StrategiesReal market, including real time underlying security level, S&P 500 index, VIX levels are displayed for reference of the market sentiment. Front month S&P 500 futures and its comparison to futures fair value often serves a good pre-market indicator and as well as predication of the market sentiment for the trading day.
 -
 Tradition Profile - Iron CondorAs comparison, this is the traditional display of a strategy payoff. It's for the expiry day only. The Grid provides a two-dimensional full profile of a strategy after its entry to its exit. PnL and Greeks provide complete risk and profit assessment of the strategy.
 -
 Traditional profile - calendar spreadThe payoff profile for calendar spread.
 -
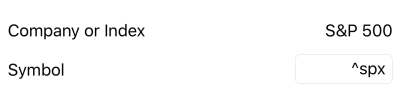 Search for symbolThe Grid can accommodate for stock or index with listed options. Input the financial symbol. Once the symbol is validated, its current price will be downloaded and the Grid will be reset accordingly.